

Dogecoin started a fresh decline from $0.0820 against the US Dollar. DOGE is declining and might drop toward the $0.065 support zone.
- DOGE failed to clear $0.0820 and started a fresh decline against the US dollar.
- The price is trading below the $0.080 zone and the 100 simple moving average (4 hours).
- There is a key bearish trend line forming with resistance near $0.078 on the 4-hours chart of the DOGE/USD pair (data source from Kraken).
- The pair could decline further if there is a move below $0.0720.
Dogecoin Price Drops Further
After a minor increase, Dogecoin’s price faced resistance near $0.0820. DOGE formed a high near $0.0815 and started a fresh decline, similar to Bitcoin and Ethereum.
There was a clear move below the $0.0800 support and the 100 simple moving average (4 hours). The bears were able to push the price below the key support at $0.0775. A low is formed near $0.0734 and the price is now showing bearish signs.
DOGE is trading below the $0.080 zone and the 100 simple moving average (4 hours). There is also a key bearish trend line forming with resistance near $0.078 on the 4-hours chart of the DOGE/USD pair.
On the upside, the price is facing resistance near the $0.0775 level. It is close to the 50% Fib retracement level of the recent decline from the $0.0815 swing high to the $0.0734 low. The next major resistance is near the $0.078 zone and the trend line.
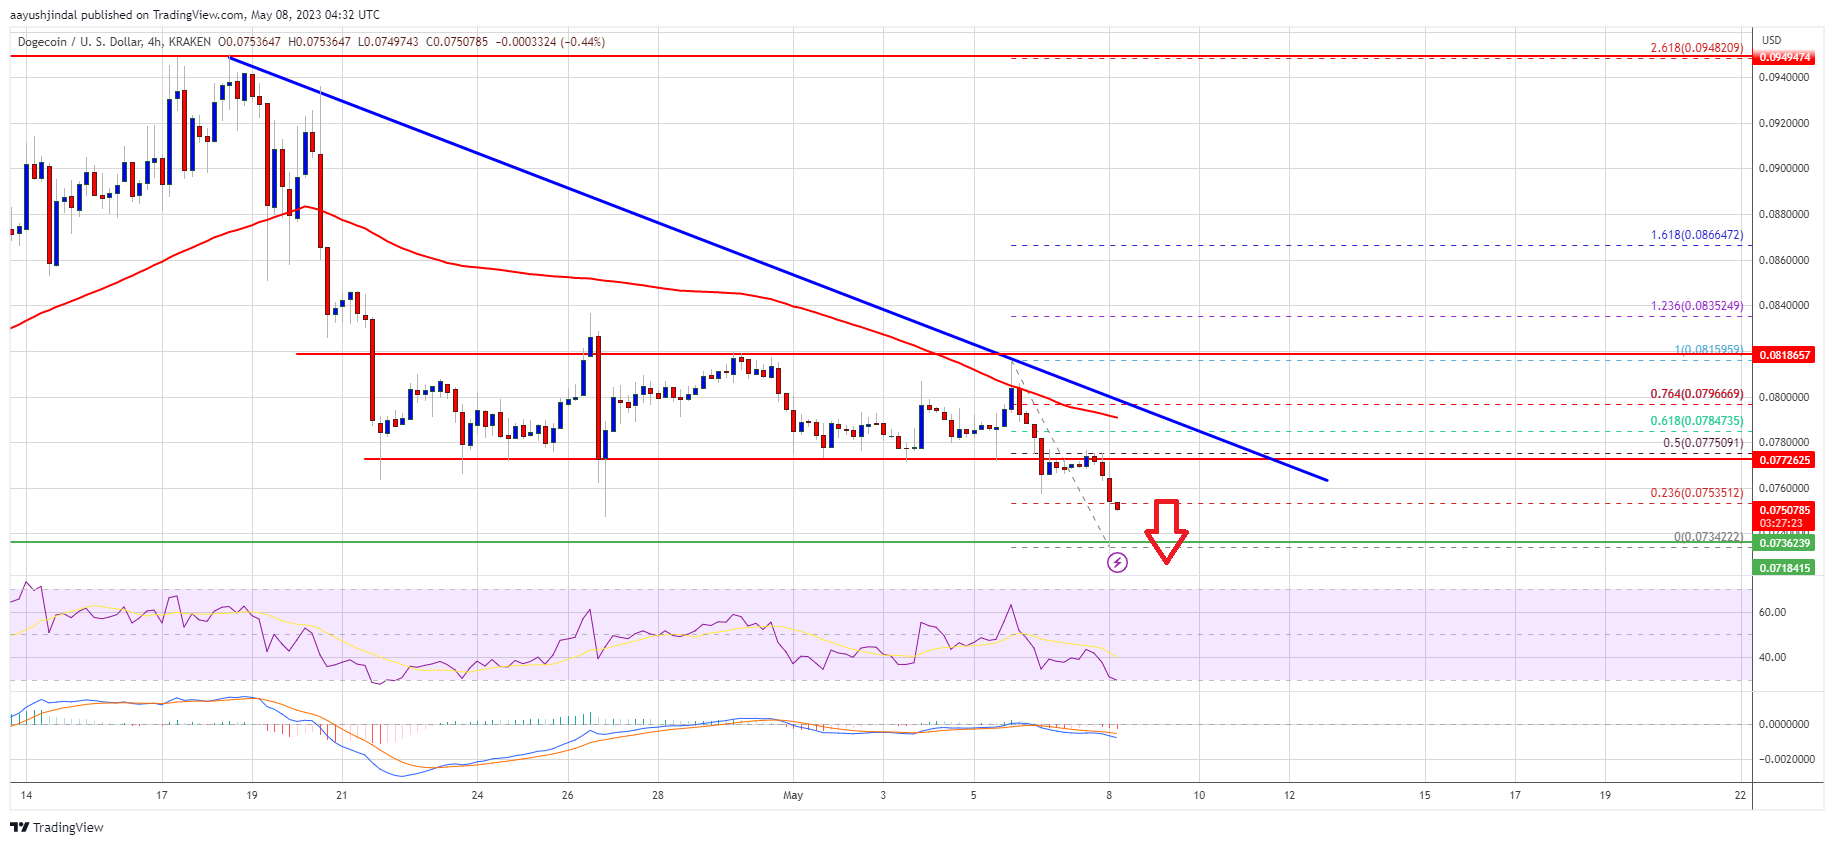
Source: DOGEUSD on TradingView.com
The trend line is close to the 100 simple moving average (4 hours) and the 61.8% Fib retracement level of the recent decline from the $0.0815 swing high to the $0.0734 low. A close above the $0.078 resistance might send the price toward the $0.082 resistance. The next major resistance is near $0.0850. Any more gains might send the price toward the $0.090 level.
More Losses in DOGE?
If DOGE’s price fails to gain pace above the $0.078 level, it could continue to move down. Initial support on the downside is near the $0.0735 level.
The next major support is near the $0.0720 level. If there is a downside break below the $0.072 support, the price could decline further. In the stated case, the price might decline toward the $0.070 level.
Technical Indicators
4 Hours MACD – The MACD for DOGE/USD is now gaining momentum in the bearish zone.
4 Hours RSI (Relative Strength Index) – The RSI for DOGE/USD is now below the 50 level.
Major Support Levels – $0.0735, $0.072, and $0.070.
Major Resistance Levels – $0.0775, $0.0780, and $0.082.